


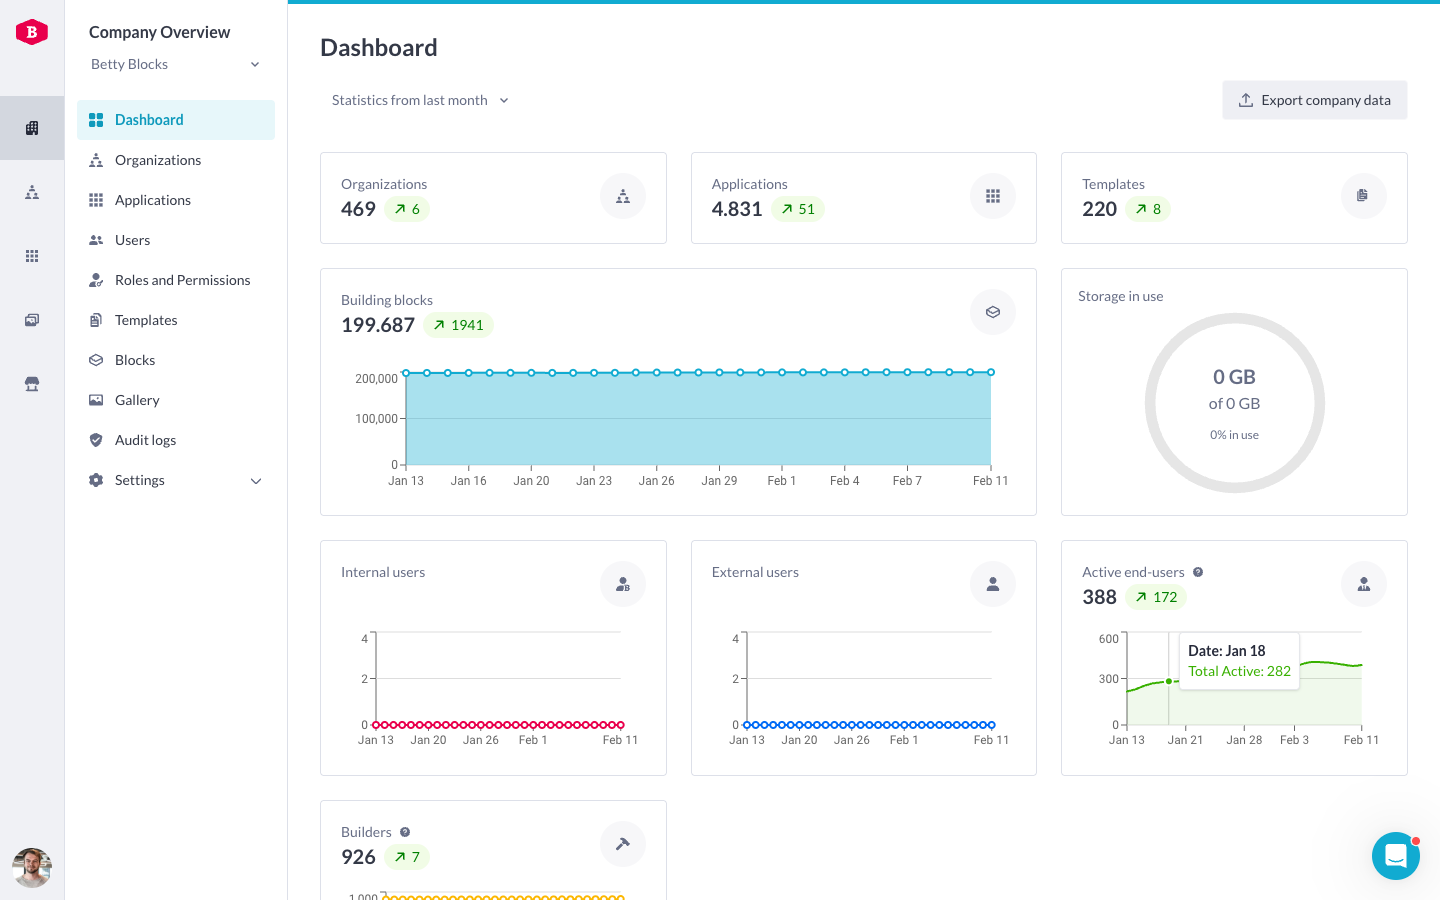
We’re excited to introduce a major enhancement to the company dashboard, giving company managers deeper insights into key statistics over time. With this update, we’re also adding a powerful new metric: active end-users, providing a clear view of user engagement across applications.
This helps company admins and managers monitor user activity trends and demonstrate the ongoing value of our platform within their organization.
What is new?
Growth over time – See how key platform statistics evolve month over month. We now track growth trends for the following statistics:
- Organizations
- Applications
- Templates
- Building blocks
- Internal users
- External users
- Builders
Alongside these enhancements, we’ve also introduced a new key metric: Active end-users—tracking the unique number of users who have logged in within a given month.
Why this matters
Measure platform ROI – Ensure your investment in our platform continues to deliver value.
Justify spending – Use data-driven insights to show how your organization engages with and benefits from the platform.
Identify trends – Spot growth opportunities and flag potential issues before they impact performance.
Application adoption – Understand which applications are driving the most engagement.
How to get started
Company managers can find these new insights in two key locations:
- Company dashboard – Displays the total unique active users across all applications.
- Company overview > Applications table – Shows active users and growth numbers per application for a more granular view.
For the end-user activity tracking be sure to set the unique identifier on custom authentication profiles so that users can be deduplicated that are logging in on different applications via single sign-on. Read more about that in the documentation: Company overview
The feature is automatically enabled for company admins, so you can start exploring your data right away!
Next steps
This is just the beginning! In the upcoming sprints, we are going to add more analytic capabilities to provide building insights. Here’s what’s coming soon:
Show storage usage – After resolving some bugs we will be displaying the totale storage usage and storage usage per application again.
Active builder tracking – A new graph will be added to the company dashboard and individual application pages, showing active builders over time.
Last activity per user – Gain visibility into when each user was last active, helping admins track engagement and optimize platform usage.
That is all for now, your feedback allows us to continuously improve our product. Please let us know what you think about it. Happy building! 😃